Tutorial 1 - predefined regions
Demo data for the tutorial can be downloaded from Zenodo.
import pandas as pd

import SplIsoFind

import warnings
warnings.filterwarnings("ignore", category=FutureWarning)
/athena/tilgnerlab/scratch/lim4020/2024_12_20_stereoseq_mousebrain/Reproducibility/SplIsoFind_GitHub/2022_08_15_PSIprediction/envs/SplIsoFind_test/lib/python3.9/site-packages/tqdm_joblib/__init__.py:4: TqdmExperimentalWarning: Using `tqdm.autonotebook.tqdm` in notebook mode. Use `tqdm.tqdm` instead to force console mode (e.g. in jupyter console)
  from tqdm.autonotebook import tqdm
Process allinfo file
Assign cell type and brain region to every read. For this we use the allinfo_addct() function from the preprocess_scisorseqr.py scripts. This uses the allinfo file outputted by IsoQuant, the SR adata file, and the CIDmap. From the SR adata file we extract the labels so we know which cell type and region of each cell. The CIDmap file indicates which barcodes belong to which cell ID.
All cells are labeled using CT_REGION.
fn_allinfo = 'data/allinfo_ds.gz'
fn_CIDmap = 'data/sample1_barcodeToPos.CellID_ds.tsv.gz'
fn_adata = 'data/sample1_cellbin_adjusted.h5ad'
fn_out = 'data/allinfo_ds.filtered.labeled.gz'
SplIsoFind.pp.allinfo_addct(fn_allinfo, fn_CIDmap, fn_adata, fn_out)
Number of reads:
446520
Number of reads with at least 1 splice junction:
372190
Number of reads overlapping segmented cells:
226461
Number of reads with label:
162445
Create auxiliary files
The files are needed by Scisorseqr for every dataset
Iso-IsoID.csv: assigns an ID to every isoform
NumIsoPerCluster: indicates how often each isoform was counted per cell type
fn_allinfo = 'data/allinfo_ds.filtered.labeled.gz'
output_dir = 'data/scisorseqr/demo/'
SplIsoFind.pp.create_auxiliary_files(fn_allinfo, output_dir)
Number of reads:
162445
Number of reads with isoform assigned:
105769
Running scisorseqr
We run scisorseqr for different groups of cells (either all cells or a specific cell type) and brain regions (e.g. the broad brain regions, cortical layers, or hippocampal subregions). For every test (e.g. All cells in the hippocampus), we created celltype files to define the pairwise tests that scisorseqr has to perform. These files contain 4 columns:
Name of first group (e.g. CA1_ML)
Labels of the reads considered to be in this group (other_CA1_ML,ExciteNeuron_CA1_ML,InhibNeuron_CA1_ML,Astro_CA1_ML,Oligo_CA1_ML)
Name of the second group (e.g. CA2)
Labels of the reads considered to be in this group (ExciteNeuron_CA2,other_CA2,InhibNeuron_CA2,Astro_CA2)
For more information and installation details of scisorseqr we refer to the original GitHub (https://github.com/tilgnerlab/scisorseqr)
Below is the example code which can be ran in the terminal to run scisorseqr on all celltype files:
cd 'Demo/Data/scisorseqr/demo/'
mkdir res_scisorseqr
cd res_scisorseqr

# Loop over all regions and celltypes
files=$(ls ../../ct_files)
for file in $files; do
    echo "Filename: $file"
    mkdir $file
    cd $file
    cp ../../../ct_files/$file .

    # Copy files to the IsoQuantOutput folder since this is what scisorseqr automatically uses as input
    mkdir IsoQuantOutput
    cp ../../Iso-IsoID.csv IsoQuantOutput/
    cp ../../NumIsoPerCluster IsoQuantOutput/

    # Run scisorseqr
    Rscript -e 'library(scisorseqr); DiffSplicingAnalysis("'"$file"'")'
    echo "Finished processing $file"
    echo
    echo

    cd ../
done
NOTE: Due to the small size of the downsampled allinfo file, not all comparisons might work.
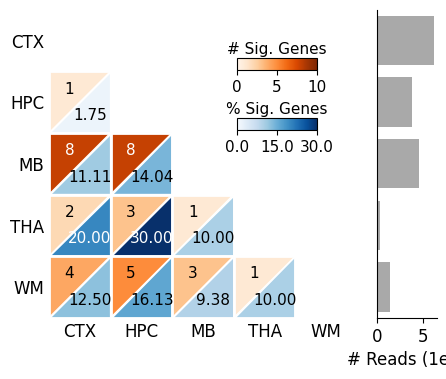
Plot results in a heatmap
See some example plots below.
allinfo = pd.read_csv('data/allinfo_ds.filtered.labeled.gz',
                     index_col=0, header=None, sep='\t')
allinfo.head()
| 1 | 2 | 3 | 4 | 5 | 6 | 7 | 8 | 9 | 10 | 11 | 12 | |
|---|---|---|---|---|---|---|---|---|---|---|---|---|
| 0 | ||||||||||||
| ec4fe453-a962-419a-b961-34de928d482e_34_1753_+ | ENSMUSG00000025903.15 | other_Midbrain | ATACAGCTTGAACTGCATTCCGCGG | TGCCTCCCAC | ;%;chr1_4878206_4878677_+;%;chr1_4878710_48988... | NoTSS | NoPolyA | ;%;chr1_4878052_4878205_+;%;chr1_4878678_48787... | known | 8 | ENSMUST00000027036.11 | protein_coding |
| 1daab6bf-00b9-46b1-ab4c-3e38c43ce7c5_31_2557_+ | ENSMUSG00000025903.15 | other_Midbrain | AGTACGTGACCCAGGGTTGTCGTAG | TACCGGTCCA | ;%;chr1_4878206_4878677_+;%;chr1_4878710_48988... | NoTSS | chr1_4916963_4916963_+ | ;%;chr1_4878121_4878205_+;%;chr1_4878678_48787... | known | 8 | ENSMUST00000027036.11 | protein_coding |
| 5e9a5ec1-4c11-4f4c-9fde-b22b8b4ef75e_0_2538_- | ENSMUSG00000025903.15 | ExciteNeuron_CA3_ML | CTGGAAGTACTGCCTAAGACACAAG | CTAAGAGGGA | ;%;chr1_4878206_4878677_+;%;chr1_4878710_48988... | NoTSS | chr1_4916963_4916963_+ | ;%;chr1_4878132_4878205_+;%;chr1_4878678_48787... | known | 8 | ENSMUST00000027036.11 | protein_coding |
| f227cc3d-3334-4029-a137-4c13317dd618_34_2230_+ | ENSMUSG00000025903.15 | other_L4 | GATCTATGTCTTACCACTTTAAACG | TCGAAACTGC | ;%;chr1_4907298_4909609_+;%;chr1_4909712_49111... | NoTSS | chr1_4916963_4916963_+ | ;%;chr1_4907278_4907297_+;%;chr1_4909610_49097... | known | 3 | ENSMUST00000027036.11 | protein_coding |
| de5497de-77cd-4d78-911f-aa18af555008_10_2065_- | ENSMUSG00000025903.15 | ExciteNeuron_CA1_ML | ATGAGCGACTATGCGGTGGCTGAGC | TCCTCGCATCG | ;%;chr1_4911356_4915185_+ | NoTSS | chr1_4916963_4916963_+ | ;%;chr1_4911187_4911355_+;%;chr1_4915186_49169... | known | 1 | ENSMUST00000027036.11 | protein_coding |
# Used to rename the regions in the plot
region_map = {
'Cortex': 'CTX',
'HPC': 'HPC',
'Midbrain': 'MB',
'Thalamus': 'THA',
'WM': 'WM'
}
SplIsoFind.pl.plot_heatmap(input_dir='data/scisorseqr/',
dataset='demo',
region='All',
celltype='All',
allinfo=allinfo,
region_map=region_map, region_map2=region_map
)
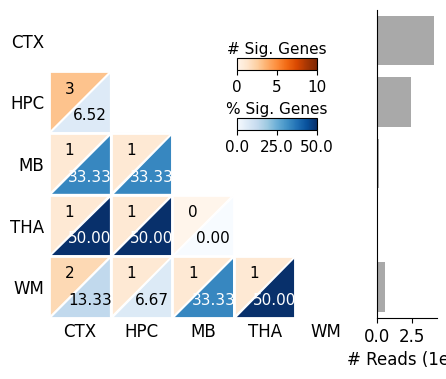
SplIsoFind.pl.plot_heatmap(input_dir='data/scisorseqr/',
dataset='demo',
region='All',
celltype='ExciteNeuron',
allinfo=allinfo,
region_map=region_map, region_map2=region_map
)
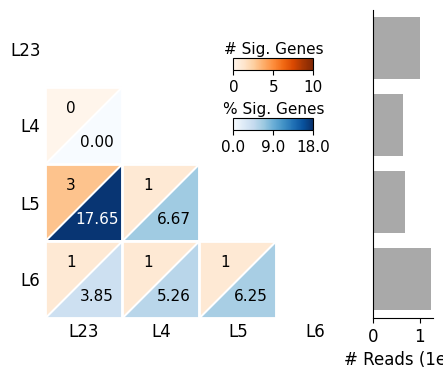
SplIsoFind.pl.plot_heatmap(input_dir='data/scisorseqr/',
dataset='demo',
region='cortex',
celltype='ExciteNeuron',
allinfo=allinfo,
region_map=None, region_map2=None
)
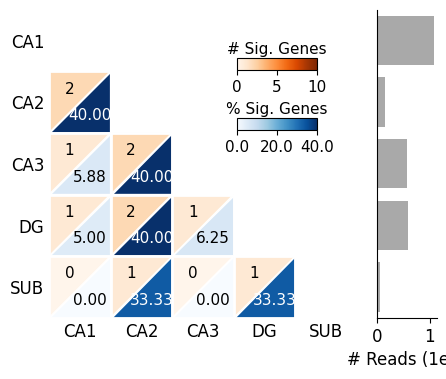
region_map = {
'CA1': 'CA1',
'CA2': 'CA2',
'CA3': 'CA3',
'DG': 'DG',
'Subiculum': 'SUB'
}
region_map2 = {
'CA1_ML': 'CA1',
'CA2': 'CA2',
'CA3_ML': 'CA3',
'DG_ML': 'DG',
'Subiculum': 'SUB'
}
SplIsoFind.pl.plot_heatmap(input_dir='data/scisorseqr/',
dataset='demo',
region='HPC',
celltype='ExciteNeuron',
allinfo=allinfo,
region_map=region_map, region_map2=region_map2
)